|
Universidade Federal de Viçosa Viçosa, MG. Brasil |
Program Genes A Software in
the Area of Genetics and Experimental Statistics |
Departamento
de Biologia Geral Viçosa,
MG. 36570-00 |


Introduction
To breed genetically superior plants, the selected
individuals must simultaneously unite a series of properties to produce a
comparatively higher yield and to meet consumer demands. A way to increase the
chances of success of a breeding program is to perform reliable experiments,
generating a great volume of experimental data. Based on an adequate processing
of these data, genetic parameters can be estimated and biological phenomena
interpreted. In this phase of result analysis and interpretation, appropriate
software systems and computer resources are of utmost importance.
The development of software in the field of plant
Genetics and Breeding is crucial due to the scarcity of such resources
available to the scientific community. The availability of such tools would
supply the increasing demand of users in numerous research institutions who
deal with an enormous volume of data, requiring adequate ways of processing to
accurately estimate statistical and biological parameters.
Particularly in the case of plant
genetics, it is noted that the intensive breeding of many species and the
complexity of the most important traits require the use of increasingly
accurate selection criteria. In all breeding stages, breeders must use
information that is expressed in parameters of the biometric models, which are
usually available in the output of most scientifically oriented software
systems.
Description
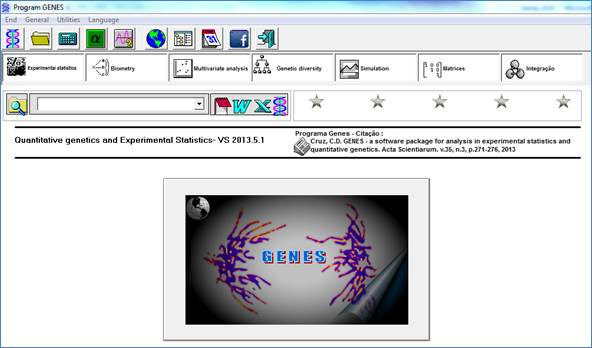
The software GENES is compatible with IBM
PCs and requires the Windows operating system. Some configuration settings are
indispensable, such as a screen resolution of 1024 x 768 (large fonts) and the
use of a decimal symbol expressed by points. The package comprises 257
executable projects, 131 text documents in rtf format, occupying about
285Mbytes, available in English, Spanish and Portuguese.
Application of the program
An application of the program Genes
usually includes the following steps:
a. Examples
of data files: Examples of data files to be processed by Genes are
available, which are particularly useful in initial studies, for providing a
double learning effect about the operation of the application itself and of the
statistical and biometrical techniques used. Each procedure is represented by
an icon that accesses the file containing an illustrative example of a particular
procedure, with the advantage of the complete description of all its parameters
for immediate data analysis.
b. Supplying data for processing: The procedures generally have a common
sequence of data analysis. Basically, the user provides the name of the file
containing the data to be processed, information about the parameters (number
of variables, treatments, blocks etc.), the names of the variables (optional),
and then prints or saves the results. It is recommended that these data files
should be in .txt format, but they are importable from excel spreadsheets.
The data are supplied in a file containing
a data spreadsheet, in which each column represents a certain characteristic to
be analyzed and each row the experimental observation. Sometimes, the first
columns are reserved to describe classificatory variables or descriptor
effects, e.g., treatments, blocks, years, locations etc.
c. Parameter Description: For each procedure, the user must provide specific
information on the data file that will be used in processing. For each
procedure, specific information is requested. Thus, for example, to perform
variance analysis, the user should provide the number of variables to be
analyzed, the number of treatments and the number of blocks or replications. In
other procedures, other information will be solicited, but in the different
procedures, the control buttons on the right side of the screen are common.
These buttons represent:
Return: ends operations on the screen of
parameter identification.
Read Data: reads the file data,
considering all rows and columns. This option is useful to identify gaps in the
structure of the data file. Through statistics indicating average, maximum and
minimum, possible typos can be detected. An error in data reading would definitely
lead to errors in data processing, so that the user must apply the necessary
corrections, according to the specification of each procedure, to ensure
correct data reading and analyses.
d. Definition of names of variables: After providing the information in the
procedure of parameter identification, the user can name the variables
analyzed. If the variables are not named, the program will apply the
description: X1, X2, … , Xn.
e. Result output: Results are provided by a proper editor of the program
Genes. However, the output file can be exported to Word, allowing the use of
all features of this powerful editor. In this case, we present the results in a
file with font Courier New 8, with customized heading and page numbering.
Results can also be exported to Excel or Wordpad and
diagrams and figures to Excel or Mspaint.
Modules
The Genes software system contains
analysis modules that involve several procedures of biometric analysis, as
described below.
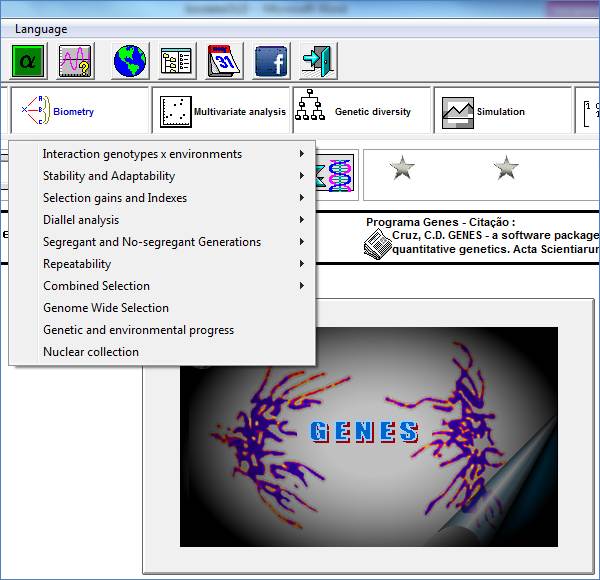
Biometrics
Biometrics is the application of
statistics to the biological field, being essential for planning, assessment
and interpretation of all data obtained in research in the biological area. A
growing user demand is noted in various research institutions in the biological
area, especially with a view to genetic studies, which deal with large data
volumes. This requires an adequate processing, to ensure an accurate estimation
and interpretation of the statistical and biological parameters. But there is a
market gap for software that would supply this demand. In this context, the
program GENES was developed to cover mainly the area of biometrics, with
numerous procedures for an adequate data processing. The following procedures
are available in this module:
a. Genotype x Environment Interaction:
stratification analysis, dissimilarity and correlations between environments.
b. Stability and Adaptability: analysis by
methods based on ANOVA (traditional, Plaisted and
Peterson, 1959, Wricke, 1965 and Annicchiarico,
1992), regression (Eberhart and Russell, 1966, Finlay
and Wilkinson, 1963 and Tai, 1971), bi-segmented
regression (Verma, Chahal
and Murty, 1978, Silva and Barreto,
1985 and Cruz, Torres and Vencovsky, 1989) nonparametric
analysis (Huehn, 1990, visual analysis and Lin and Binns, 1988), analysis of factors and main components or
centroids.
c. Genetic gains from selection – Indices:
calculation of gains by selection between families (univariate
and indices), considering direct and indirect selection, the classic index of Smith,
1936 and Hazel, 1943, based on the sum of ranks of Mulamba
and Mock, 1978, base index of Williams, 1962, multiplicative index of Subandi et al., 1973, weight-free index of Elston, 1963, based on the desired gains of Pesek and Baker, 1969 and on the genotype-ideotype distance index. Calculation of gains by selection
between families by univariate methods or by the
following restricted indices: classic index of Smith, 1936, and Hazel, 1943, of
Kempthorne and Nordskog,
1959, of Tallis, 1962, of James, 1968, and of Cunningham
et al., 1970. Calculation of gain by selection among families considering collinearity indices, indices of gains by selection among
and within families, in balanced and unbalanced experiments, by massal and stratified selection among and within families. Visual selection analysis, multi-environment selection and
prediction of gains by selection within, without information from plants within
a plot.
d. Diallel
Analysis: Analysis of balanced diallels
(Methodologies of Griffing, 1956, Gardner and Eberhart, 1966, Hayman,1954, and Cocherhan
and Weir,1977, tests among hybrids and reciprocals crosses, prediction of
compounds and hybrids and of family indices) joint diallel
analysis (of balanced diallels of Griffing,
1956, of Gardner and Eberhart, 1966, and of partial
and circulating diallels), Partial diallels
(by the methodologies of Geraldi and Miranda Filho, 1988, of Miranda Filho and
Geraldi,1984, of Kempthorne, 1966, of Viana et al., 1999, and prediction of triple and double hybrids). Analysis of circulating, circulating partial and unbalanced diallels.
e. Analysis of Segregating and
non-segregating generations: scale joint test (P1, P2, F1, F2 with optional
inclusion of BC1 and BC2), analysis of
experiments of segregating lines and parents in alternating rows and analysis
of plants in generation Ft and the derived Ft+1 lines.
f. Repeatability: Analysis of original or
classified data.
g. Combined selection: analysis of
experiments of families with balanced and unbalanced data. Analysis
of genetic design proposed by Comstock and Robinson (1948).
h. Genetic and Environmental Progress.
i. Nuclear Collection.
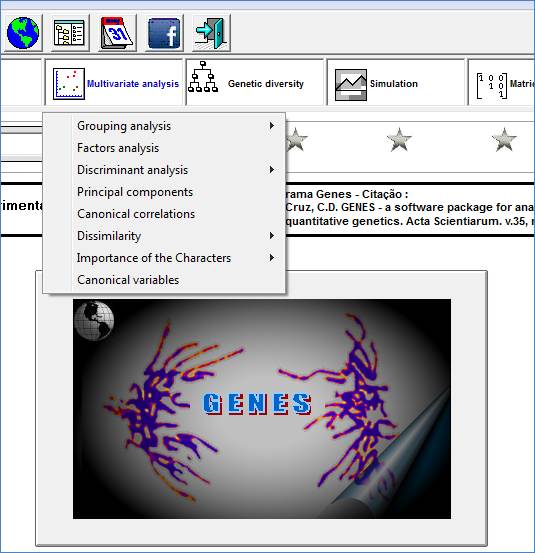
Multivariate Analysis
The designation multivariate analysis
represents a large number of methods and techniques that simultaneously use all
variables in the analysis, interpretation and processing of the data set from a
biological phenomenon under study. The mathematical complexity, typical of
multivariate methods, has inhibited the transfer of the underlying stochastic
fundamentals and principles to the researchers. However, the key part, which is
the statistical inference, has been stimulated through the use of
well-constructed software with a user-friendly interface for researchers. In
the program Genes, the scientist will find the following:
a) Analysis of structural simplification:
Principal Components and Canonical Variable Analysis.
b) Association Analysis: Path analysis,
Canonical Correlations and Factor analysis
c) Analysis of diversity: Discriminant
Analysis (by the method proposed by Anderson or based on principal components).
Measures of Dissimilarity: based on continuous, multicateegoric
or binary phenotipic quantitative variables. Analysis
of molecular data from dominant or codominant
markers; cluster analysis: Tocher optimization
method, hierarchical, graphic dispersion and 2D and 3D projection. Identification of more and less similar accessions.
Importance of traits: by main components or the distance by Mahalanobis’
Generalized distance and canonical variable analysis.
Simulation
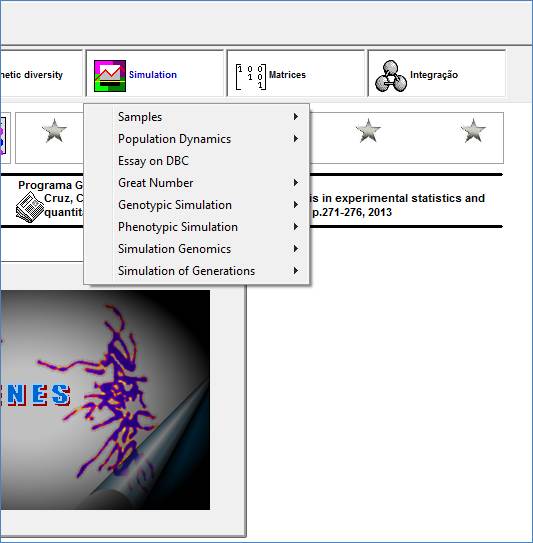
One the major contributions of computing
is that phenomena can be studied by simulating
a complex situation in which parameters and constraints are established, so
that the effect of certain controllable factors can be conveniently studied.
Simulation is defined as a way of imitating the behavior of a real system by
computational resources to study its functioning under alternative conditions,
involving certain types of logic models to describe, as best as possible, the
natural system .
Simulations are highly useful in genetic
studies in various contexts, including studies of populations, the individual
or of the proper genome. They require the development of appropriate biological
models to represent the phenomena of interest as ideally as possible by
researchers and suitable procedures of processing by programmers, according to
the parameters and constraints, so that the influence of certain factors can be
assessed.
Genes contained the procedures: Simulation
of experiments, Simulation of Samples (p
populations and v variables), Optimal
Number of Families, Optimal Number of Plants (Random
or predifined Sampling) and Optimal Number of
Replications or Optimal Sample Size
Genetic Diversity
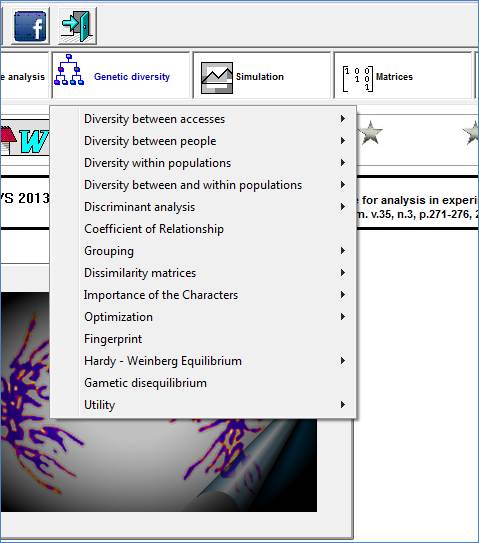
Studies on diversity can be directed to
plant breeding, evolutionary associations, conservation and management of plant
material, among other purposes. In each case, an adequate methodology and
appropriate information are required. The data of measured units, plants,
accessions or taxa can be phenotypic or genotypic. Phenotypic information is
derived from the evaluation of characteristics with continuous or discrete
distributions, of which the latter can be multicategoric
or binary. Genotypic data are obtained from molecular markers or DNA
sequencing. In the case of markers, there are dominant or co-dominant and diallelic or multiallelic types.
All these situations are addressed in the application Genes, by the approach:
a. Diversity between accessions: based on
continuous, multi-categoric, binary phenotypic
variables, and analysis of data of dominant and codominant
(multi-allelic) markers.
b. Diversity between populations: Nei’s Genetic identity Calculation (1972) and the following
distances: Euclidean, of Rogers, Angular, of Goldstein et.
al (1985) and of Hedrick.
c. Diversity within populations: calculation
of the coefficient of endogamy and heterozygosis, Shannon-Wiener index and
heterozygosis from binary data.
d. Diversity among and within populations:
descriptive analysis, Nei’s diversity index (1973),
Wright’s fixation index (Two alleles or Multiple alleles), analysis of heterozygosity of Weir (1996). Analysis of Contingency
Table, ANOVA of allelic frequency (F, f and q), AMOVA of Excoffier
et al (1992) and analysis of binary data.
e. Discriminant Analysis: discriminant
analysis of Anderson, analysis based on main components or in k-nearest
neighbors. Discriminant analyses from the dissimilarity matrices.
f. Grouping analysis: using the following
methods: Tocher optimization and hierarchical
methods, by graphic dispersion, 2D and 3D projection and analysis of more and
less similar accessions. Matrices of
Dissimilarities: calculation of the correlation and sum between elements of
matrices of dissimilarity. Importance of traits: considering phenotypic
quantitative characters or molecular information, by means of MANOVA
g. Optimization:
Analysis of the optimal number of binary or multi-allelic markers for the study
of genetic variance. Simulation:
simulation of populations, crossings and population samples, under the effect
of divergent selection or genetic drift.
h. Relationship coefficient and
Hardy-Weinberg Equilibrium: Population analysis based on the information of codominant diallelic or
multi-allelic markers. Analysis of Gametic
Disequilibrium.
Experimental Statistics
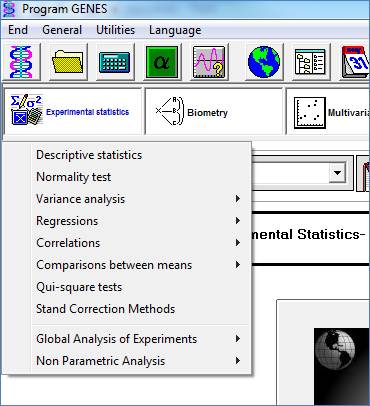
This module contains procedures based on
statistical models with wide application in various areas of research and
undergraduate and graduate teaching. The importance of statistical analysis is
the probabilistic proof of the truth of a particular hypothesis formulated
based on extensive studies and on analyses of the research results. In
statistics, parameters estimates related to the data are presented and
interpreted per se, or hypothesis are tested and
results are associated with probability values by means of statistical tests.
Usually, the use of a particular inferential statistics is directed by the
study question. The software Genes offers the following procedures for
statistical analyses:
a. Descriptive Statistics, Normality Test
and Stand Correction Methods
b. Variance Analysis: analysis of
completely randomized designs and schemes, of experiments with regular and
non-regular treatments, in randomized blocks, factorial and subdivided plots. Analysis of origin/progeny/plant, simple and triple lattices and
hierarchical models.
c. Regressions: simple linear, non-linear,
multiple and polynomial, response surface and 3D graphical analysis.
d. Correlations: calculation of genetic
correlations, partial and canonical Pearson and Spearman correlations. Path analysis (involving 1 or 2 chains) and path analysis under collinearity.
e. Comparison of Means: Tests of Tukey, Duncan, Scheffé and Scott
and Knott, Tukey test with variable number of
replications, Dunnett, t test, Tocher,
and chi-square test to evaluate hypotheses, heterogeneity and factorial
linkage.
Matrices
The study of matrices is considered
fundamental because it is an important tool in this area of mathematics related
to calculations and parameter estimation. It is widely applied in estimation
methods and model adjustments, such as least squares and maximum likelihood and
different matrix analyses. The following procedures are available in Genes:
a. Diagnosis of multicollinearity
b. Algebra of matrices
c. Solution of the system ![]()
d. Solution of the system ![]()
Integration with other software
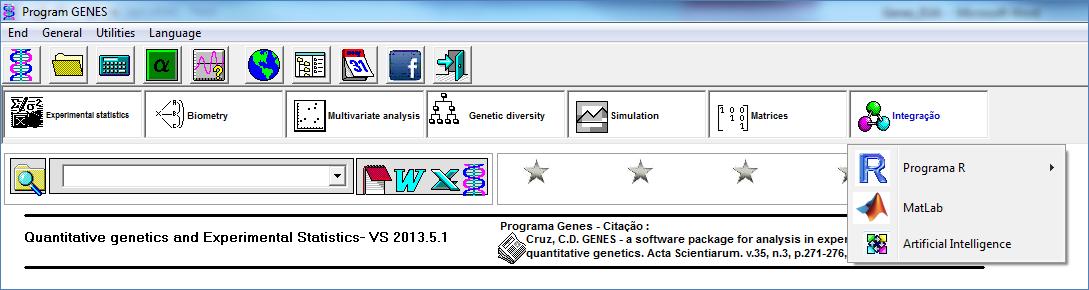
Currently, the software GENES has 205
executable projects involving the modules of experimental statistics,
biometrics, multivariate analysis, genetic diversity, and simulation matrices.
Thus, each procedure has a particular data set for which an appropriate
biometric template is prepared that will allow the user to process data and
generate and properly interpret results of the studied phenomenon. However,
additional analyses may be required or even some differentiated form of
carrying out the same kind of study may be evaluated. In this case, the user
would surely be willing to try a new analysis option provided no effort is
required to understand the particular access to an alternative program or
supplement. The user of software GENES has direct access to other applications
such as:
Microsoft Word: designed to receive output results and emit reports
Microsoft Excel: designed to receive outputs or results of
complementation analysis, in particular graphical analysis.
Microsoft Paint: designed to receive figures, images, and diagrams
resulting from the analysis to which, as the researcher sees fit, graphical
resources can be applied to improve the aesthetics of the result.
Free software environment R: For each procedure available within
software GENES, the user finds a set of instructions for the appropriate
settings so that the data can be accessed and processed by program R, according
to the researcher’s demand. The program R has been increasingly accepted by
universities and companies around the world. Nowadays, the acquisition costs of
statistical software packages that are similar or even poorer in terms of
analysis capacity, are very high, especially for the
predominantly small and medium businesses in our country. Thus, the inclusion
of this facility in Genes is yet a another
contribution to the use of R, intended to break barriers and facilitate the
construction of diagrams and data analyses of quality data, at no cost and with
the same reliability as of other software.
Matlab®: Software GENES generates established scripts by a
set of sentences or commands to perform or solve problems of a particular type
of study based on a set of data or information, within the Matlab
program. Matlab is an interactive system whose basic
data element is an array that does not require dimensioning. This system allows
the resolution of many numerical problems in a fraction of the time one would
spend writing a similar program in Fortran, Basic or
C. Moreover, solutions to problems are expressed almost exactly as they are
written mathematically. Each script consists of set of methods organized and
documented by one or more parts of a process allowing, if necessary, the
identification and correction of errors by means of debugging the script to
obtain a solution with no errors.
Acknowledgements
The author gratefully acknowledges FAPEMIG,
CAPES and CNPq for their financial support.
References
concerning the software system
|
|
CRUZ,
C. D. . Programa Genes - Análise multivariada e simulação. 1. ed. Viçosa, MG:
Editora UFV, 2006. v. 1. 175 p. |
|
|
CRUZ,
C. D. . Programa Genes - Biometria. 1. ed. Viçosa,MG: Editora UFV, 2006. v.
1. 382 p. |
|
|
CRUZ,
C. D. . Programa Genes - Diversidade Genética. 1. ed. Viçosa, MG: Editora
UFV, 2008. v. 1. 278 p. |
|
|
CRUZ, C. D. . Programa Genes - Estatística
Experimental e Matrizes. 1. ed. Viçosa: Editora UFV, 2006. v. 1. 285 p. |